I heard something distressing today about the sloppiness of coronavirus research. The Fairbanks School at IUPUI has been doing a big study of coronavirus infection in Indiana, testing 5,000 people. I was one of those people (negative on virus, negative on antibodies, as it turned out). I heard they were calling for volunteers, so I signed up on the web. They accepted me, and gave me a choice of testing sites. I chose the Bloomington one at an IU Health Center on the West Side. I drove up and a heavily armored man stuck a long swap up my nose and held it there for a painful ten seconds. Then I waited in the parking lot in my car for half an hour until the National Guard medics were ready to take a blood sample for the antibody test. A few days later my results came back via email and website.
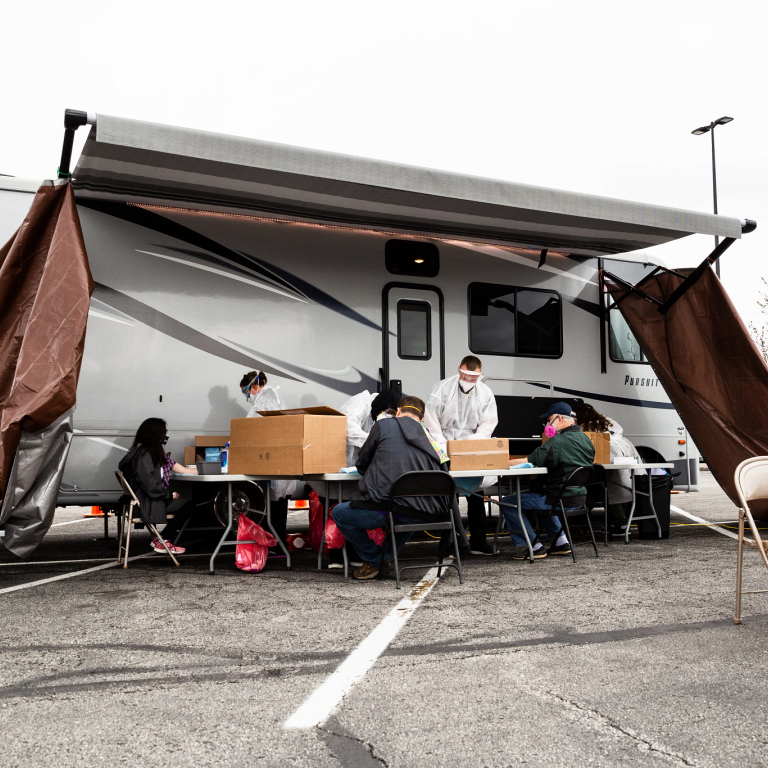
Photo by Liz Kaye, Indiana University
The distressing part is what I read today, in the New York Times and in Indiana University press releases. The New York Times op-ed said
This study in Indiana sought to be truly statewide and random. Researchers at the Indiana University Fairbanks School of Public Health created a data set of all people listed in state tax returns for the last two years. This included filers, co-filers and dependents. They linked this list to data from the Bureau of Motor Vehicles and Family and Social Services Administration to come up with contact information for everyone.
They then randomly selected people over 12 years of age, making sure to cover individuals from all over the state. Those who agreed to participate were scheduled to be tested at one of 68 state sites and then asked to fill out comprehensive questionnaires about symptoms, health status, behaviors and demographics….
More than 4,600 people participated in the first wave; 1.7 percent were found to have an active infection. Serological testing, for antibodies, was positive in an additional 1.1 percent of people. That indicates that overall, 2.8 percent of people living in Indiana were infected or have recovered.
The New York Times is notoriously unreliable, so they didn’t get it quite right. “This number includes more than 3,600 people who were randomly selected and an additional 900 volunteers recruited through outreach to the African American and Hispanic communities to more accurately represent state demographics.:
That’s fine. Rather than omit people who don’t pay taxes, have a driver’s license, or are registered with the
Family and Social Services Administration, it’s better to accept volunteers from those people— though I wonder why they didn’t try to get volunteers from that omitted group who weren’t African-American or Hispanic, since I would guess that they’ve excluded a majority of those omitted from sampling. In Bloomington, for example, my impression is that practically none of the homeless people are African-American or Hispanic, and that’s the kind of person they were trying to get to volunteer, and soliciting for Hispanics would probably just get more economics professors and classical cellists.
So far, so good. That’s the kind of random study we need. But you will note a problem. Why was I in the study? They didn’t call me; I called them. I did it via a website that asked for volunteers. I’m not African-American or Hispanic. So I was not supposed to be in this study.
It gets worse. When I registered, I thought it would be nice if my whole family could get tested— my wife and the three teenagers I still have at home. And all my friends, too, might be interested in getting tested. I didn’t, though, because I knew that would wreck their study. It was bad enough relying on over-the-transom volunteers, I thought, because someone who thought he might have coronavirus would be more likely to volunteer. But it would be much worse if the volunteers had their family and friends volunteer too, because then the data points wouldn’t be independent. Where the statistical software thought it had 5 separate data points, it would really have more like 1.3—-the Eric Rasmusen household. Or where it thought it had 30, it would really have more like 4.6— Eric Rasmusen and Friends. If Eric Rasmusen had the virus, this would tend to overestimate the infection rate; if he did not, it would underestimate it. So I didn’t have my family sign up.
At the testing site, though, I thought I’d find out whether I’d made the right decision in refraining from getting the free tests for friends and family. I asked the National Guard medics whether I was right not to have my family apply. They had no idea, being just medics for drawing blood, but they called in an older man who seemed to be the on-the-site IUPUI guy. I don’t think he understood why I thought it would be a problem. He said it would be fine for them to apply, but the study only needed people with certain demographics, so they might not be accepted for testing. The web form had asked me things like my age, recent medical symptoms, education level, sex, and geographical location, so I think they were using stratified sampling, looking at their random sample and their volunteers and selecting from them a random subsample that would resemble the Indiana population in its demographics. I was selected because they needed more 61-year-old males with college education from Monroe County.
So what is going on? Was the web registration software for volunteers up there by mistake? I can’t locate it now. I think it was probably at https://research.indianactsi.org/clinicaltrial/, but I’m not sure. My test results are up at https://registration.coronavirus.in.gov/lab-results/ . How many of the 3,600 are actually not randomly sampled, but volunteers? (a “convenience sample”). I note that the study was supposed to have 5,000 people, but only had 4,600 in this first wave. Did the researchers have trouble getting enough of the randomly sampled people to accept testing (too low a “response rate”) and switch to using volunteers instead? If so, they didn’t say that in the press release.
This needs some fixing. In statistics, the most important thing is to get a truly random sample. If you don’t do that, no amount of fancy mathematical techniques are going to get you correct results. A small truly random sample is better than a gigantic biased sample. Having a sample of 5,000 is quite unnecessary as far as estimating the percentage of people in Indiana infected. The Law of Large Numbers kicks in very quickly, and 200 would be enough, if the sample were truly random. The study wants to go further, I’m sure, and estimate things like the percentage of Terre Haute high-school dropouts aged over 60 who are infected. For that, you need a sample of 200 Terre Haute high-school dropouts aged over 60, so that’s a reason to have 5,000 for the entire state. But for estimating the Indiana infection rate, what needs to be done is to strip out the volunteers like me, even if that reduces the sample size down to 1,000.
This is a continuing study, so it’s important to fix problems now.
“As valuable is our data has been, it is the next wave, planned for early June, that will be even more valuable,” said Professor Menachemi. “We plan to test another statewide random sample in a few weeks to determine how much the virus has further spread in Indiana. This information will be critical for decision makers.”https://news.iu.edu/stories/2020/05/iupui/releases/13-preliminary-findings-impact-covid-19-indiana-coronavirus.html
It will indeed be critical. So let’s get it right.
1 reply on “Does Professor Menachemi’s Fairbanks-IUPUI Covid-19 Study of Indiana Infection Rates Have a Biased Sample?”
[…] have other posts on covid-19 at Covid-19 Precautions Masks and Slobs Signal, Noise, and CDC Masks Does Professor Menachemi’s Fairbanks-IUPUI Covid-19 Study of Indiana Infection Rates Have a Biased… Signal, Noise, and CDC The Cost of Covid-19 Excommunication by Covid Church, State, and […]